
Self-service analytics lets non-technical staff explore, query, and visualize business data without waiting on IT, using dashboards or plain-language questions instead of code. IBM defines it as tools that translate everyday questions into charts and answers in seconds. The real payoff is decision speed: teams get answers the same day instead of the same quarter, provided the data behind those answers is governed. AdaptAI has watched this play out with small business clients who finally stop guessing and start checking.
Table of Contents
- What self-service analytics actually includes
- The real benefits, and where they can backfire
- What to look for in a self-service analytics platform
- The roadmap: pilot, measure, expand
- How AdaptAI approaches this for small and medium businesses
- Who owns what: roles in a self-service analytics setup
- Why training matters more than the tool
- Where self-service analytics actually gets used
- How this changes decision-making culture
- Why most self-service rollouts underdeliver, and what actually fixes it
- Ready to make self-service analytics actually work for your team?
- Sources
- FAQ
What self-service analytics actually includes
Two distinct approaches sit under this umbrella, and confusing them is where most rollouts go sideways. The first is governed dashboards: pre-built, filterable views that a sales manager or clinic administrator can slice by date, region, or product without touching a query editor. The second is conversational or generative AI interfaces, where a user types "what were refunds last month by region?" and the system writes SQL behind the scenes. Gartner's definition centres on the first type, business users querying and reporting with nominal IT support, but the second is growing fastest because it removes even the small learning curve dashboards require.
Dashboards fit repeatable, high-frequency questions. Conversational interfaces fit exploratory, one-off questions that don't justify building a permanent view. Most mature setups use both.
Whichever route you pick, a few technical pieces have to be in place first:
- Semantic layer: a translation layer that maps "revenue" or "active customer" to one consistent definition everywhere it's used.
- Connectors and warehouse: the pipes that pull data from your CRM, invoicing tool, or point-of-sale system into one queryable source.
- UI pattern: dashboards, spreadsheet-style grids, or natural-language search, chosen to match how your team actually thinks.
- Governance and logging: access rules and an audit trail showing who asked what and which dataset answered it.
Enterprise stacks bundle all four with heavy configuration. Lightweight setups can get a small team functional in weeks by connecting existing databases and defining a handful of KPIs rather than building a full data warehouse first.
The real benefits, and where they can backfire
The upside is concrete: fewer emails to the one analyst who knows how to pull the sales report, and faster answers for everyone else. When a support manager can check ticket volume by product line without submitting a request, that analyst's week opens up for the modelling work nobody else can do.
Adoption depends on more than access. Statistics Canada's data literacy guidance treats training as an organisational priority, not an optional add-on, because tools with a low skill floor still get misread by people who haven't learned to question a number before acting on it.
That's the trade-off worth naming honestly:
- Speed gains are real: certified data plus self-service access shortens the loop between question and decision.
- Analyst time gets reallocated, not eliminated, toward forecasting and strategy instead of ad hoc report pulls.
- Misinterpretation risk rises when users pull numbers from uncertified sources without understanding filters or date ranges.
- Metric drift and dashboard sprawl happen fast. Give ten people dashboard-building access and you'll have ten slightly different definitions of "active customer" within a month.
- Governance, meaning certified datasets and a small owned set of metrics, is what keeps the speed gain from turning into confusion.
None of this cancels the benefit. It just means self-service without literacy training is a faster way to make confident, wrong decisions.
What to look for in a self-service analytics platform
Skip the feature checklist and start with governance, because it's the piece vendors gloss over and the piece that determines whether your rollout survives past month three.
- Certified datasets and metric lineage. Can you see where a number came from and who signed off on its definition? If not, every dashboard is a guess wearing a chart.
- Native connectors and realistic latency. Confirm the platform connects directly to your CRM, invoicing system, and warehouse, and ask what the actual refresh delay looks like under load, not in the sales demo.
- Access controls that go beyond login and password. Role-based permissions and row-level or column-level restrictions matter the moment you have finance data sitting next to sales data in the same system.
- User experience that matches your team's comfort level. Natural-language query is only useful if the generated query is visible and explainable, not a black box spitting out numbers nobody can verify.
- Cost profile matched to your scale. Enterprise-grade stacks with full governance can run $80,000 to $150,000 a year and take three to six months to configure, while a lightweight setup can deliver most of the practical value for a fraction of that if your team is under fifty people.
Pro Tip: Before evaluating a single platform, write down the ten questions your team asks most often about the business. If a tool can't answer those cleanly out of the box, no amount of flexibility elsewhere will make the rollout stick.
The roadmap: pilot, measure, expand
The single biggest rollout failure is trying to expose every dataset to everyone on day one. Oracle's implementation guidance is blunt about this: solve the handful of questions people actually ask before opening the doors wider.
- Identify the top ten recurring stakeholder questions. Talk to department heads directly rather than guessing. These become your first certified dashboards.
- Certify a small set of datasets and KPI definitions. Assign one owner per dataset who is accountable for accuracy, not a committee.
- Run a bounded pilot with a defined group. A compact setup focused on five to ten metrics with one responsible owner beats a sprawling rollout with none.
- Schedule onboarding and training sessions, not a one-time email with a login link. Adoption without instruction is how misread dashboards happen.
- Track adoption honestly. Watch ticket reduction to the analyst team, actual dashboard usage versus logins, and whether duplicate or conflicting metrics start appearing.
- Expand gradually, adding embedded alerts and shareable views once the pilot group shows consistent, correct usage.
Skipping straight to step six is the single most common way self-service analytics projects get quietly abandoned within a year.
How AdaptAI approaches this for small and medium businesses
Most SMBs don't have a data warehouse problem. They have a fragmented-tools problem: CRM in one login, invoicing in another, scheduling in a third, and a report someone builds manually in a spreadsheet every Friday. Self-service analytics can't work well on top of that mess because there's no single certified source to query.
AdaptAI builds custom software systems that consolidate those tools behind one login first, which is what makes trustworthy self-service possible in the first place. Consolidating multiple operational tools can lead to reduced administrative work, as staff spend less time re-entering data across systems and more time accessing a single source of truth.
The relevant pieces of that work:
- Custom integrations that connect CRM, invoicing, and scheduling data into one queryable structure.
- Data modelling that defines your actual KPIs instead of forcing a generic template on your business.
- Ongoing AI training for your team, so the people using the dashboards understand what they're looking at, not just how to click filters.
Who owns what: roles in a self-service analytics setup
Self-service doesn't mean IT disappears. It means IT's job shifts from producing every report to maintaining the infrastructure that lets others produce their own safely.
Data or IT teams own the semantic layer, connector maintenance, and access controls. They decide what counts as a certified dataset and keep the pipes running. Business analysts shift from report-runners to dataset owners and coaches, spending more time validating metric definitions and less time pulling the same sales report every Monday. Department leads become accountable for how their team uses data, flagging when a metric looks wrong instead of assuming the dashboard is always right. End users, meaning the frontline staff actually clicking through dashboards, need enough literacy to question a number before presenting it in a meeting.
The friction point is almost always the same: someone assumes "self-service" means nobody owns the data anymore. In practice, ownership just moves from a centralized reporting queue to a distributed set of named, accountable people. Skip naming those people and you get exactly the metric drift and dashboard sprawl that turns a promising pilot into a graveyard of abandoned tabs within six months.
Why training matters more than the tool
A platform with a low skill floor still requires teaching people how to use it correctly. Statistics Canada's data literacy framework treats this as a formal organisational priority, and for good reason: the easier a tool is to use, the easier it is to misuse without noticing.
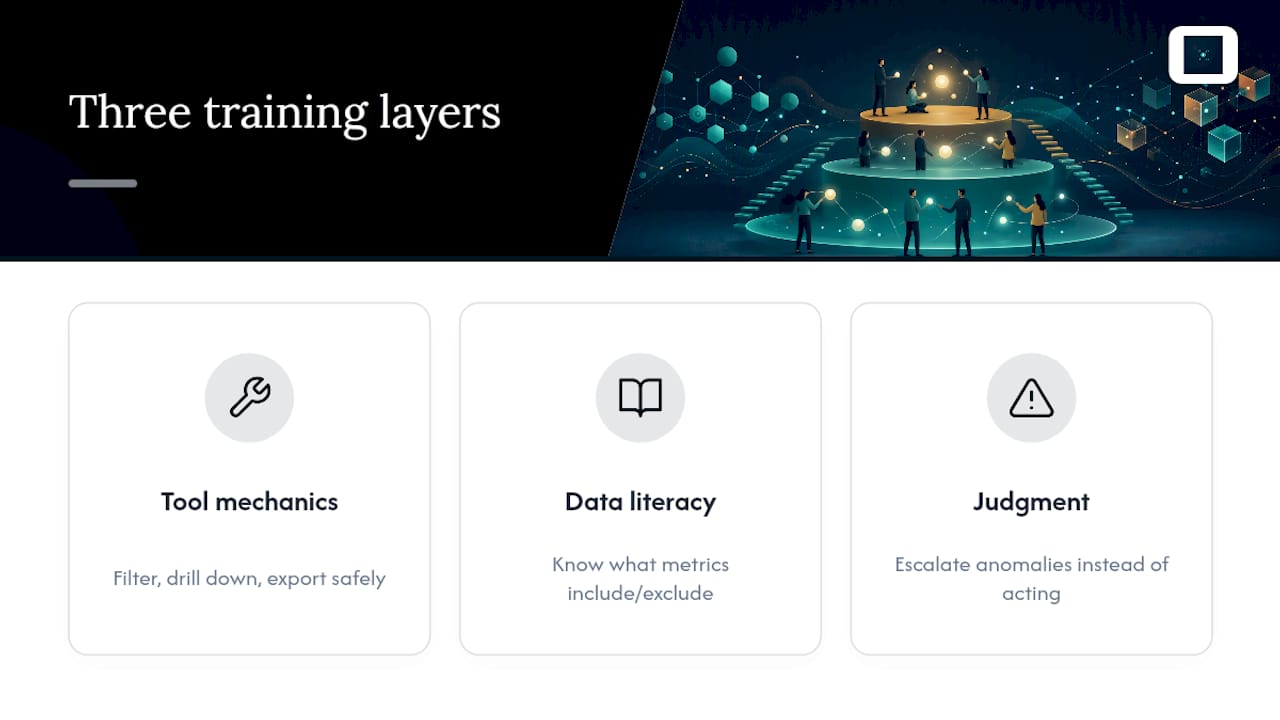
Effective training covers three layers. First, tool mechanics, meaning how to filter, drill down, and export without breaking a dashboard for the next viewer. Second, data literacy, meaning understanding what a metric definition includes and excludes, so nobody compares gross revenue in one dashboard to net revenue in another and draws the wrong conclusion. Third, judgment, meaning knowing when a number looks off enough to escalate rather than act on immediately.
This doesn't need to be a semester-long course. A short onboarding session tied to the certified starter dashboards from your pilot, followed by a refresher once the platform expands to more users, covers most of the risk. The teams that skip this step are usually the ones fielding "why don't these two numbers match" complaints six weeks after launch.
Where self-service analytics actually gets used
Retail and hospitality operators use it to check daily sales by location without waiting for a weekly rollup, catching a slow location on a Tuesday instead of finding out at month-end. Professional services firms, including accounting and legal practices, use certified dashboards to track billable hours and utilization by team member, replacing a manual spreadsheet that used to take half a day to update.
Healthcare clinics use it for appointment volume and no-show rates by provider, feeding scheduling decisions in near real time rather than through a monthly report. Manufacturing and logistics operations track inventory turnover and shipment delays, where a natural-language query like "which suppliers were late more than twice last month" replaces a support ticket to a data team that might take days to answer.
The common thread across every one of these cases: the value shows up when the question is repeatable enough to justify a dashboard, or urgent enough that waiting for a formal report defeats the point.
How this changes decision-making culture
The cultural shift is subtler than the technical one, and it's the part leadership teams underestimate most. When answers take a week, people make decisions on instinct and backfill the justification later. When answers take five minutes, the habit of checking before deciding actually starts to form.
That shift doesn't happen automatically just because a dashboard exists. It happens when leadership visibly uses the data themselves, in meetings, in front of the team, instead of falling back on gut calls when a dashboard is sitting right there. Teams notice which behaviour gets rewarded.
The flip side is a culture where every disagreement turns into a dashboard duel, with two people pulling slightly different numbers from uncertified sources to win an argument. That's not a data-driven culture. That's dashboard sprawl wearing a data-driven costume, and it's exactly why the certified dataset and metric ownership pieces from earlier aren't optional extras.
Why most self-service rollouts underdeliver, and what actually fixes it
The conventional pitch treats self-service analytics like a light switch: buy the tool, hand out logins, watch productivity climb. That framing sets almost every rollout up to disappoint, because the tool was never the bottleneck. The bottleneck was always whether your data lived in one trustworthy place with agreed definitions before anyone touched a dashboard.
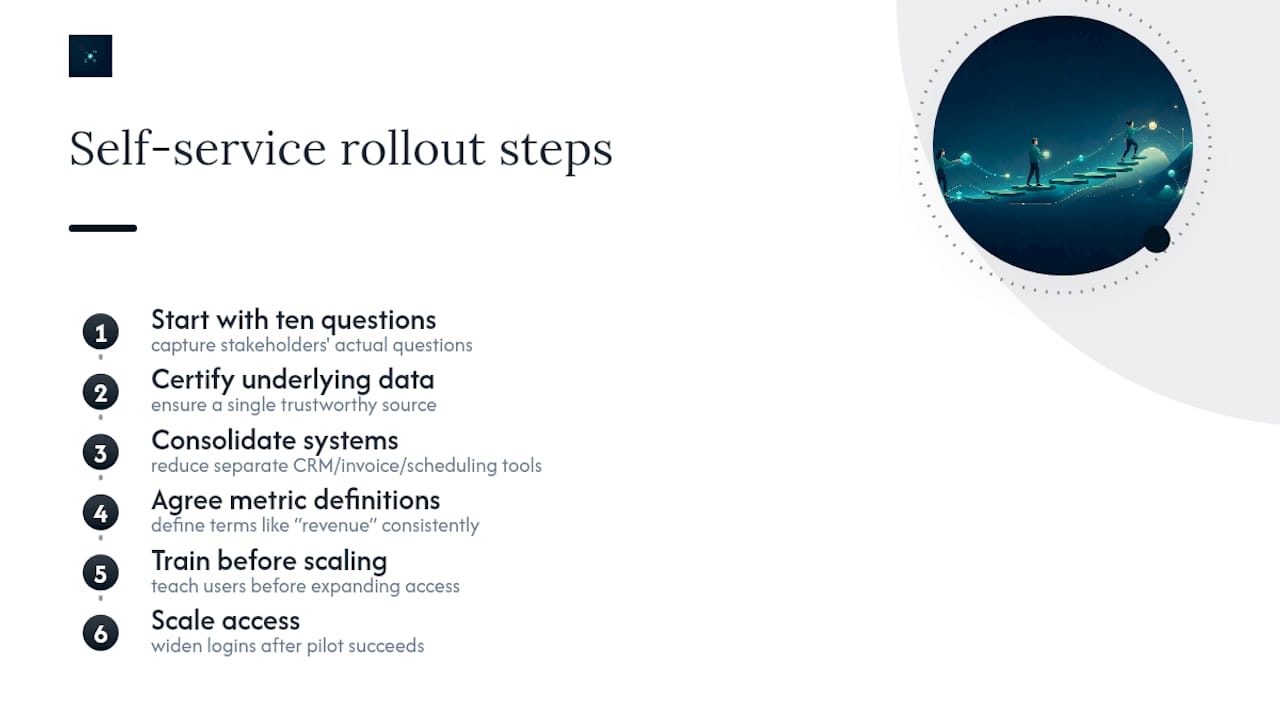
What the evidence here actually supports is narrower and less exciting than the vendor pitch: start with the ten questions your stakeholders actually ask, certify the data behind those answers, and train people before you scale access. That's slower to announce in a company meeting, but it's the version that survives past the pilot.
The overrated piece is the interface itself, whether it's a slick natural-language search bar or a drag-and-drop dashboard builder. The underrated piece is the boring infrastructure work of consolidating your systems and agreeing on what "revenue" means before anyone gets access. Businesses running five separate tools for CRM, invoicing, and scheduling will get less out of any analytics platform than a business running one consolidated system, no matter how good the front-end interface is. Fix the plumbing first. The dashboard is the easy part.
— Harry Gill
Ready to make self-service analytics actually work for your team?
Here's the honest bottleneck for most small and medium businesses: self-service analytics can't deliver fast, governed decisions when your CRM, invoicing, and scheduling data all live in separate systems with no shared definitions. Buying an analytics tool on top of that fragmentation just gives you a faster way to look at inconsistent numbers.
AdaptAI builds the consolidation layer first, a custom software system that connects your existing tools behind one login, so the data feeding your dashboards is actually trustworthy before you scale access to your whole team. We also run AI training workshops so your staff can interpret dashboards correctly from day one, not just click through them. If you're not sure where your business stands on data readiness, the AdaptAI Readiness Stack™ gives you a clear starting point across five dimensions before you commit to a build. Book a discovery call to walk through your current tool stack and get a straight answer on whether consolidation should come before or alongside your analytics rollout.
Sources
- What is Self-Service Analytics? | IBM
- Data literacy training | Statistics Canada
- What is self-service business intelligence? | TechTarget
- Self-Service Analytics | Gartner glossary
- How to set up business intelligence without a data team | Basedash
FAQ
What is self-service analytics?
It's a category of business intelligence that lets non-technical employees query, explore, and visualize data directly, without submitting a request to IT or a dedicated analyst, typically through dashboards or natural-language search.
Is data analytics still worth investing in for IT in 2026?
Yes. Self-service shifts IT's role from producing every report to maintaining the connectors, semantic layer, and access controls that keep self-service data trustworthy, which is arguably more valuable work, not less.
What are the four types of analytics?
Descriptive (what happened), diagnostic (why it happened), predictive (what's likely to happen), and prescriptive (what to do about it). Self-service tools today handle descriptive and diagnostic questions well, with predictive capability growing fastest in natural-language interfaces.
What are some examples of self-service technologies?
Governed dashboard platforms, natural-language query interfaces that convert plain questions into SQL, embedded analytics inside existing business apps, and consolidated systems like the ones AdaptAI builds that merge CRM, invoicing, and scheduling data into one queryable source.