
Customer journey analytics is the practice of connecting real customer interactions across every channel, web, app, email, support, in-store, into a single, measurable timeline that shows which paths lead to revenue, retention, or churn. The top payoff is identifying the specific journeys worth fixing, so teams stop guessing and start prioritizing changes with a real revenue signal behind them. The market is projected at roughly USD 24.65 billion in 2026, and firms that treat it as an operating system rather than a dashboard, a distinction AdaptAI sees play out constantly with owner-operated businesses, tend to get there faster.
Table of Contents
- Customer journey analytics vs. journey mapping vs. web analytics
- Building the foundation: timeline tables and identity resolution
- Where journey analytics pays off first
- Practical implementation roadmap: from decisions to first value
- Data strategy, privacy, and identity in the post-cookie era
- Measuring success: KPIs, ROI, and benchmarks
- Examples of industry-specific applications and case studies
- Predictive analytics and attribution modelling in practice
- Lessons from practice: governance, ops, and incremental wins
- How AdaptAI turns journey data into one connected system
- Sources
- FAQ
Customer journey analytics vs. journey mapping vs. web analytics
These three terms get used interchangeably, and that confusion causes real budget waste. They are not the same thing, and mixing them up is one of the most common reasons journey analytics projects stall before they produce a single insight.
Journey mapping is a qualitative exercise. Someone interviews customers or workshops with stakeholders and draws a visual of the "ideal" path a buyer takes. It is useful for alignment, but it is a snapshot, not a measurement. Web analytics, meanwhile, measures what happens on your website or app in isolation, sessions, bounce rate, page views, without connecting that behaviour to what happens next in a CRM, a support ticket, or an in-store purchase. Customer journey analytics unifies real interaction data across every one of those channels to quantify which paths actually drive outcomes, rather than which paths someone assumed customers take.
Four capabilities separate genuine journey analytics from a glorified reporting dashboard:
- Path analysis: tracing the actual sequences customers follow, not the ones you designed for them
- Funnel analysis: quantifying drop-off at each stage, segmented by channel or customer type
- Attribution: assigning credit across touchpoints instead of crediting the last click
- Predictive intelligence: flagging accounts or customers likely to convert, churn, or expand before it happens
The data feeding these capabilities usually comes from five sources: web and app event logs, CRM records, support and ticketing systems, in-store or POS transactions, and marketing automation platforms. Each contributes a different layer of context, web and app show intent, CRM shows relationship history, support shows friction, and POS shows the actual transaction that validates everything upstream.
Building the foundation: timeline tables and identity resolution
Most journey analytics failures trace back to a shaky technical foundation, not a bad tool choice. Before any dashboard or predictive model can produce something trustworthy, three structural pieces need to be in place.
- A canonical timeline table. Every event, a page view, an email open, a support ticket, a purchase, gets normalized into one consistent format: timestamp, customer ID, event name, and channel. If "checkout completed" is logged as three different event names across your web team, app team, and POS system, your funnel numbers will contradict each other before you even start analyzing them.
- Identity resolution. This is the technical piece that decides whether a laptop visit, a mobile app session, and an in-store purchase all belong to the same person. Deterministic matching (login, email, loyalty ID) is the most reliable method where it is available; probabilistic matching fills gaps but introduces margin for error, which matters more in regulated industries than in casual retail.
- A data layer that supports both storage and orchestration. Most teams land data in a customer data platform or warehouse, then layer a visualization tool on top. The orchestration layer is where insights get pushed back into action, triggering a workflow, alerting a rep, updating a CRM field, rather than sitting in a report nobody opens.
A unified timeline table stitched to a persistent customer ID is the correct foundation for journey analytics, and skipping it is the single most common reason projects produce numbers nobody trusts.
Pro Tip: Build your event taxonomy before you buy or configure any tool. Write down every event name your business cares about (in plain English, "trial started," not "evt_47_conv") and get every team instrumenting against that same list. Retrofitting a taxonomy after six months of inconsistent tagging costs far more time than doing it up front.
Where journey analytics pays off first
The clearest business case for journey analytics comes from picking a handful of journeys where a small improvement compounds into real money. Five use cases consistently deliver the fastest returns:
- Funnel optimization: finding the exact step where prospects abandon and fixing that step specifically, instead of redesigning the whole funnel
- Churn prediction and retention: spotting behavioural signals (declining logins, support ticket spikes) weeks before a customer cancels
- Onboarding optimization: shortening time to first value, which correlates directly with long-term retention
- Cross-sell and expansion: identifying which journey stage signals readiness for an upgrade or additional product
- Contact-centre efficiency: routing based on journey context so agents aren't starting from zero on every call
Benchmark studies compiled by FullStory show customer journey analytics driving 10 to 15% increases in revenue and 15 to 20% reductions in service costs when implemented properly, ranges consistent enough across industries to use as a planning baseline for your own business case.
Don't try to instrument every journey in your business at once. Pick three to five that touch the outcomes leadership already cares about, usually one acquisition journey, one onboarding journey, and one retention journey, and get those working end to end before expanding scope. Teams that spread thin across a dozen journeys on day one almost always end up with shallow, unreliable data everywhere instead of deep, trustworthy data anywhere.
Practical implementation roadmap: from decisions to first value
The order of operations matters more than the tool you pick. A recommended sequence, drawn from practitioner guidance, moves through five stages:
- Start with the decisions you want to improve, not the software. Ask what specific business decision this data needs to inform, cutting acquisition spend on an underperforming channel, or flagging at risk accounts, before evaluating a single platform.
- Map three to five high-value journeys. Use the qualitative mapping exercise here, but treat it as a hypothesis to validate with data, not a final answer.
- Instrument events and normalize them into your timeline table. This is where the canonical event naming from the previous section gets put into practice.
- Resolve identities across channels. Without this step, your "unified" journey is really just several disconnected fragments wearing the same label.
- Back-test attribution models and run controlled experiments. Compare multi-touch attribution against last-click on historical data before trusting it prospectively, and validate any major insight with an A/B test or cohort comparison rather than acting on a single dashboard trend. This full sequence, defining decisions through running experiments, is the approach Fivetran recommends for teams building journey analytics from scratch.
Governance decides whether any of this produces a result. Someone needs to own each journey, someone needs the authority to act on what the data shows, and there needs to be a defined path for insights to reach the CRM, the ticketing system, or the marketing automation platform where action actually happens. Without that loop, insights become interesting slides in a quarterly review and nothing more.
Pro Tip: Assign one named owner per journey before you instrument a single event. "The analytics team" is not an owner. A specific person accountable for the onboarding journey's conversion rate will chase down a data quality issue that a shared inbox never will.
Three traps sink most projects. Treating the analytics platform as a passive dashboard instead of an operational trigger is the biggest one. Over-instrumenting dozens of low-value events before proving the concept on a handful of high-value ones is the second. Skipping identity stitching entirely, and then wondering why the "customer journey" only ever shows fragments, is the third, and it's the one that quietly undermines everything else on this list.
Data strategy, privacy, and identity in the post-cookie era
Third-party cookie deprecation changed what's technically possible, and privacy-first architecture is now a design requirement rather than a compliance afterthought. Industry analysis points to first-party data collection and data clean rooms as the approaches that recover much of the signal lost when cross-site tracking disappeared.
A few practical shifts matter here:
- First-party and server-side tracking replace third-party cookies as the primary data source, since they capture data your business collects directly rather than data purchased or inferred from external trackers.
- Consent management needs to be built into the data pipeline itself, not bolted on afterward, with clear records of what each customer agreed to and when.
- Identity technique selection depends on your business model: deterministic IDs (login, loyalty number) work best for consumer businesses with account relationships, while account-level stitching suits B2B, where the "customer" is really a group of individuals acting on behalf of one organization.
- Probabilistic matching fills gaps where deterministic identifiers aren't available, but it should be tested against known outcomes periodically to check its error rate isn't drifting.
Test your identity resolution quality directly: pick a sample of known customers and check whether their cross-channel behaviour actually gets stitched together correctly. If it doesn't, build clear fallback rules (channel-level reporting instead of person-level) rather than reporting a "unified" view that's quietly wrong.
Measuring success: KPIs, ROI, and benchmarks
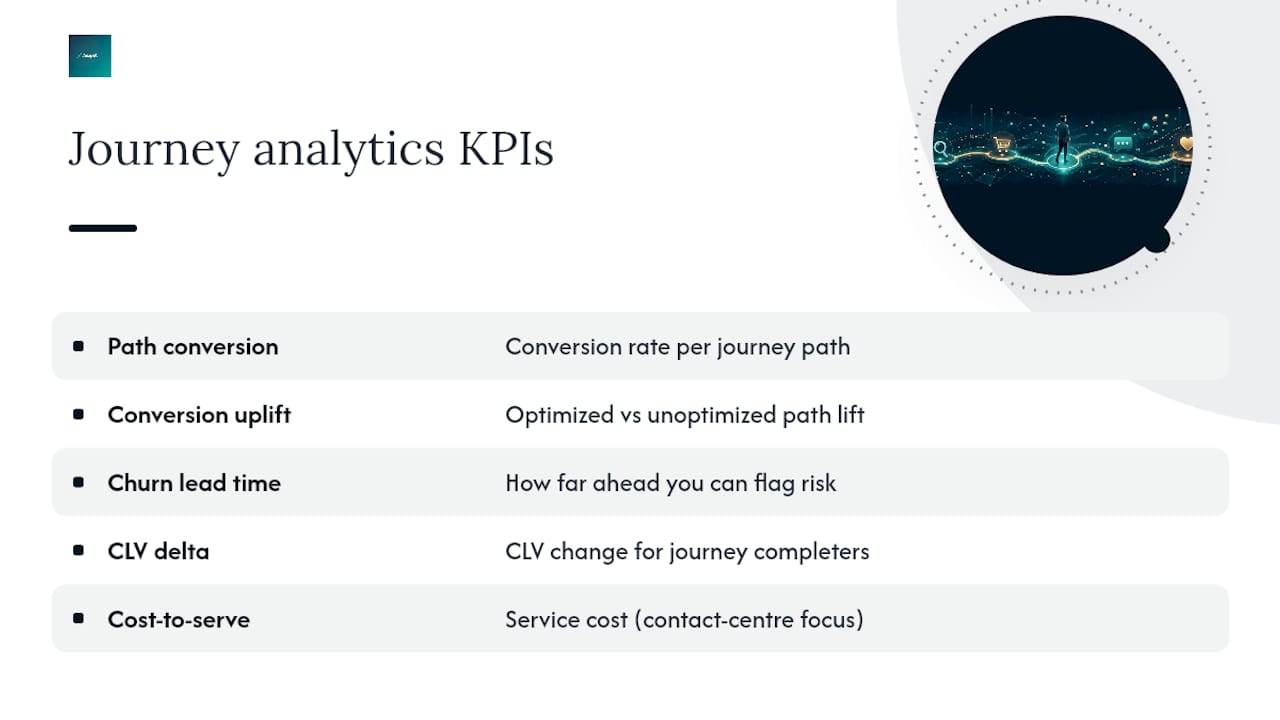
Five metrics tell you whether journey analytics is working: path conversion rate, conversion uplift by path (comparing optimized versus unoptimized journeys), churn signal lead time (how far in advance you can flag risk), CLV delta for customers who complete a given journey versus those who don't, and cost-to-serve, particularly relevant for the contact-centre use case.
A conservative way to build your business case: back-test multi-touch attribution against your current last-click model on six months of historical data. One practitioner analysis found this comparison often reveals 18 to 28% of budget misallocated under last-click attribution, budget that could be reallocated toward the channels actually driving conversions. That reclaimed spend, not a hypothetical future uplift, is often the most credible number to bring into a budget conversation.
Guard against one bias specifically: don't let a single attribution model become gospel. Run A/B tests or cohort comparisons alongside model output, since attribution models can systematically overweight touchpoints that are easy to track and underweight ones (word of mouth, in-store browsing) that aren't.
Examples of industry-specific applications and case studies
Retailers typically apply journey analytics to unify in-store POS data with online browsing, catching customers who research online and buy in person, a pattern that pure web analytics tools miss entirely because they only see half the picture. SaaS companies lean heavily on the onboarding-to-activation journey, since time-to-first-value is one of the strongest predictors of whether a trial converts to a paid account or a subscription renews past year one.
Financial services firms tend to focus on identity resolution across highly regulated channels, branch visits, mobile app, call centre, since deterministic matching through account numbers is both available and necessary for compliance reasons. Healthcare and insurance organizations apply similar logic to claims and service journeys, where a customer's path often spans months and multiple departments, making a persistent customer ID essential just to reconstruct what actually happened.
B2B businesses, including many of the operationally stretched small and medium businesses AdaptAI works with across Surrey and Metro Vancouver, face a different challenge: the "customer" journey is really several individuals (a buyer, an end user, a finance approver) interacting with the business at different times. Account-level stitching, rather than individual-level identity resolution, tends to produce a more useful picture in these cases. A business running separate systems for CRM, scheduling, and invoicing often can't see this journey at all until those systems share a single source of customer identity, which is precisely the operational gap that shows up before any journey analytics initiative can succeed.

Predictive analytics and attribution modelling in practice
Predictive models built on journey data flag customers likely to churn, convert, or expand, typically by scoring behavioural patterns, like declining engagement frequency or a spike in support tickets, against historical outcomes from similar customers. The value isn't the prediction itself; it's the lead time. A churn model that flags risk 60 days out gives a retention team room to intervene. One that flags it the week before cancellation gives them almost nothing to work with.
Attribution modelling has moved well past simple first-touch or last-touch approaches. Multi-touch models distribute credit across every touchpoint in a journey, weighted by position, time decay, or algorithmic contribution scoring. Data-driven attribution, which uses machine learning to assign credit based on actual conversion patterns rather than fixed rules, is increasingly the standard for businesses with enough volume to train a reliable model. Smaller businesses without that volume are often better served by a simpler, more transparent model, position-based or linear, since a data-driven model trained on too little data can produce confident-looking numbers that are actually noise.
The practical advice here echoes the implementation roadmap: back-test before you trust. Run your proposed attribution or predictive model against known historical outcomes before using it to guide live budget or retention decisions. A model that can't explain last quarter's results credibly won't predict next quarter's any better.
Lessons from practice: governance, ops, and incremental wins
The biggest gap I see isn't technical, it's operational. Research shows a significant gap between adoption and effective use of journey analytics tools among marketing leaders (https://www.forrester.com/blogs/customer-journey-management-in-2026-from-maps-to-measurable-impact/). That gap is almost never about the software. It's missing ownership, patchy data quality, and no defined process for turning an insight into a workflow change.
If you want faster proof that this works, start with post-purchase journeys, onboarding and early retention, rather than acquisition. They're shorter, the data is cleaner, and the ROI shows up in weeks, not quarters.
— Harry Gill
How AdaptAI turns journey data into one connected system
Journey analytics only works when the data behind it actually connects, and that's the exact problem most small and medium businesses run into first. If your CRM, invoicing, scheduling, and reporting all live in separate systems, you can't build a reliable timeline table or resolve customer identity no matter which analytics platform you buy on top of it. AdaptAI builds custom software that consolidates those systems behind one login, so customer data is connected at the source instead of stitched together after the fact.
Many clients report saving significant administrative work time once their systems are unified, time that often gets redirected into exactly the kind of journey mapping and analysis this article describes. Beyond the build, AdaptAI also runs AI training workshops so your team knows how to act on the insights once the data is flowing, not just watch a dashboard. If your operational data is currently scattered across four or five tools, the practical next step is a conversation about what a unified system would look like for your business specifically. You can start that conversation through AdaptAI's services page.
Sources
- Customer journey management in 2026: from maps to measurable impact | Forrester
- Customer Journey Analytics Market Size, Growth Drivers, Forecast 2026 – 2031 | Mordor Intelligence
- Customer journey analytics | Fivetran
- Customer journey analytics: Best practices & insights | FullStory
FAQ
What Is Customer Journey Analytics?
Customer journey analytics connects real customer interactions across channels, web, app, CRM, support, in-store, into one measurable timeline, so businesses can see which paths actually drive conversions, retention, or churn. Unlike journey mapping, which is a qualitative snapshot, it's built on quantified event data.
What Are the Stages of a Customer Journey?
Most frameworks describe five stages: awareness, consideration, purchase (or conversion), retention, and advocacy. Journey analytics measures actual customer behaviour at each stage rather than assuming customers move through them in a straight line.
What Is Customer Journey Analysis?
Customer journey analysis is the process of examining data across those stages to find where customers drop off, convert, or churn, then using that to prioritize fixes. It relies on the same data foundation, timeline tables, identity resolution, event normalization, described earlier in this article.
Is Adobe Customer Journey Analytics the Same as Adobe Analytics?
No. Adobe Analytics focuses primarily on web and app behavioural data within a single digital property, while Adobe Customer Journey Analytics is built to unify data from multiple sources, web, offline, CRM, into one cross-channel view. The distinction matters because a business evaluating either needs to know whether it's buying a web analytics tool or a true cross-channel journey platform.
How Much Does Custom Software for Journey Analytics Cost?
Pricing depends on the scope of systems being consolidated and the complexity of the identity resolution required, so AdaptAI doesn't publish a flat rate. Current project pricing is available directly through AdaptAI's services page.